url - http://en.wikipedia.org/wiki/Infographic
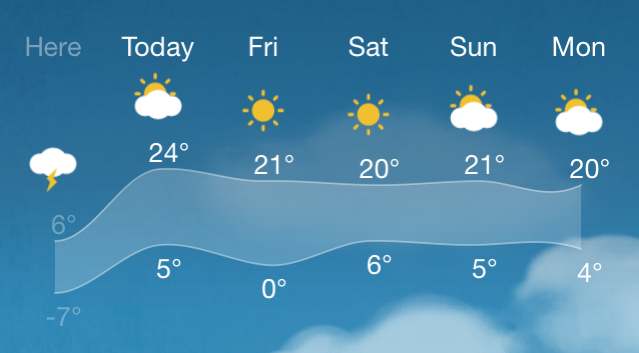
Its giving us information on how the weather is going to be for the rest of today and on Friday, Saturday, Sunday, and Monday
http://lab.pxd.co.kr/cloudia/graph_abroad.png

Its giving us information on the maintenance of the car and why it becomes so high when it gets damaged
http://blog.morethanwheels.info/wp-content/uploads/2014/10/car-ownership-infographic.jpg

Its giving us graphics on the latest Iphone Apple is selling
http://www.engineering.com/Portals/0/BlogFiles/Electronics%20Design/YAWN.JPG

Its showing us social media statistics
http://theviralmarketingexpert.com/wp-content/uploads/2014/06/Infographic-3-940x793.jpg

Its giving us information on food
https://s-media-cache-ak0.pinimg.com/236x/a0/76/3b/a0763b73d2b372f2d2e553c4a38b46e0.jpg
No comments:
Post a Comment